Check the Cron Job Status
If you notice problems with automation tasks, start by checking your cron job’s status. WHMCS includes overviews of automation activity, a dashboard widget, and other ways to monitor day-to-day automation runs and find problems.
To review your WHMCS installation’s automation activity, you can choose between the following methods:
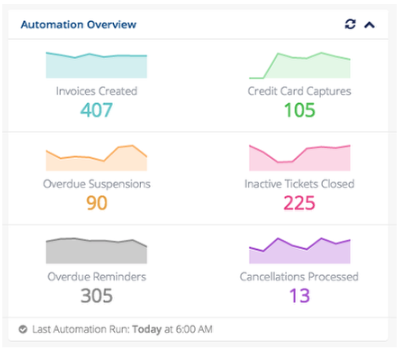
Automation Overview Widget
The Automation Overview widget in the Admin Area Dashboard provides an overview of the key automation tasks and their trends for the past seven days. Clicking on any of the graphs will take you to a detailed overview:

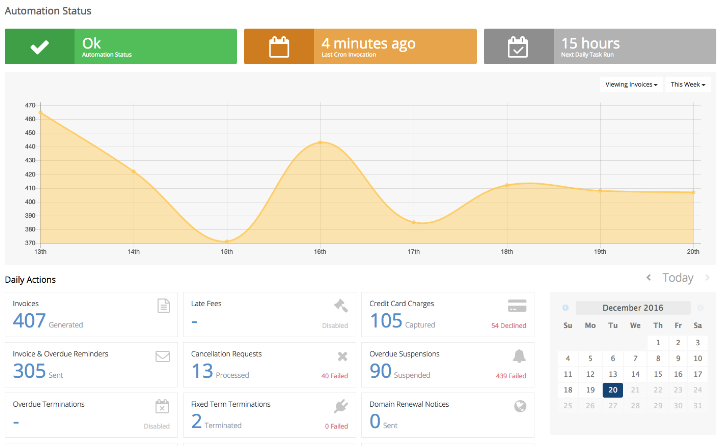
Automation Status
You can click the gear icon at the top of the Admin Area () or go to at Utilities > Automation Status:

Status Badges
The overall status of the system cron displays in the row of badges at the top of the page:
| Automation Status | Description |
|---|---|
 | A green Ok badge indicates that everything is running normally: the system has invoked the system cron within the last 120 minutes (2 hours) and the daily tasks ran successfully within the last 24 hours. |
 | A yellow Warning badge indicates that the system cron ran successfully in the past, but that the system has not invoked it in the last 120 minutes (2 hours). |
  | A red Error or Not Ok badge indicates that the system cron is not running correctly: either the system has never invoked the system cron command, or the daily automation tasks have not run successfully in the past 24 hours. |
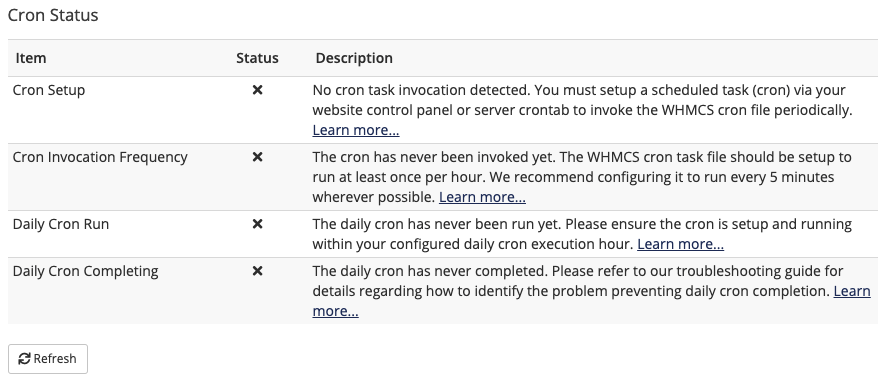
Cron Status Report
You can click the automation status badge for a full report of recent cron activity.

Cron tasks that failed display an x icon under Status. Click Learn more under Description for a failing item to view more information and help to resolve the issue.
After you resolve an issue, wait at least five minutes and then click Refresh to view the status of the newest cron run.
Last modified: 2025 March 19